e!Sankey
With e!Sankey you can now create Sankey diagrams even easier and betterUpdated on 03. Jul 2026 by SoftGuide
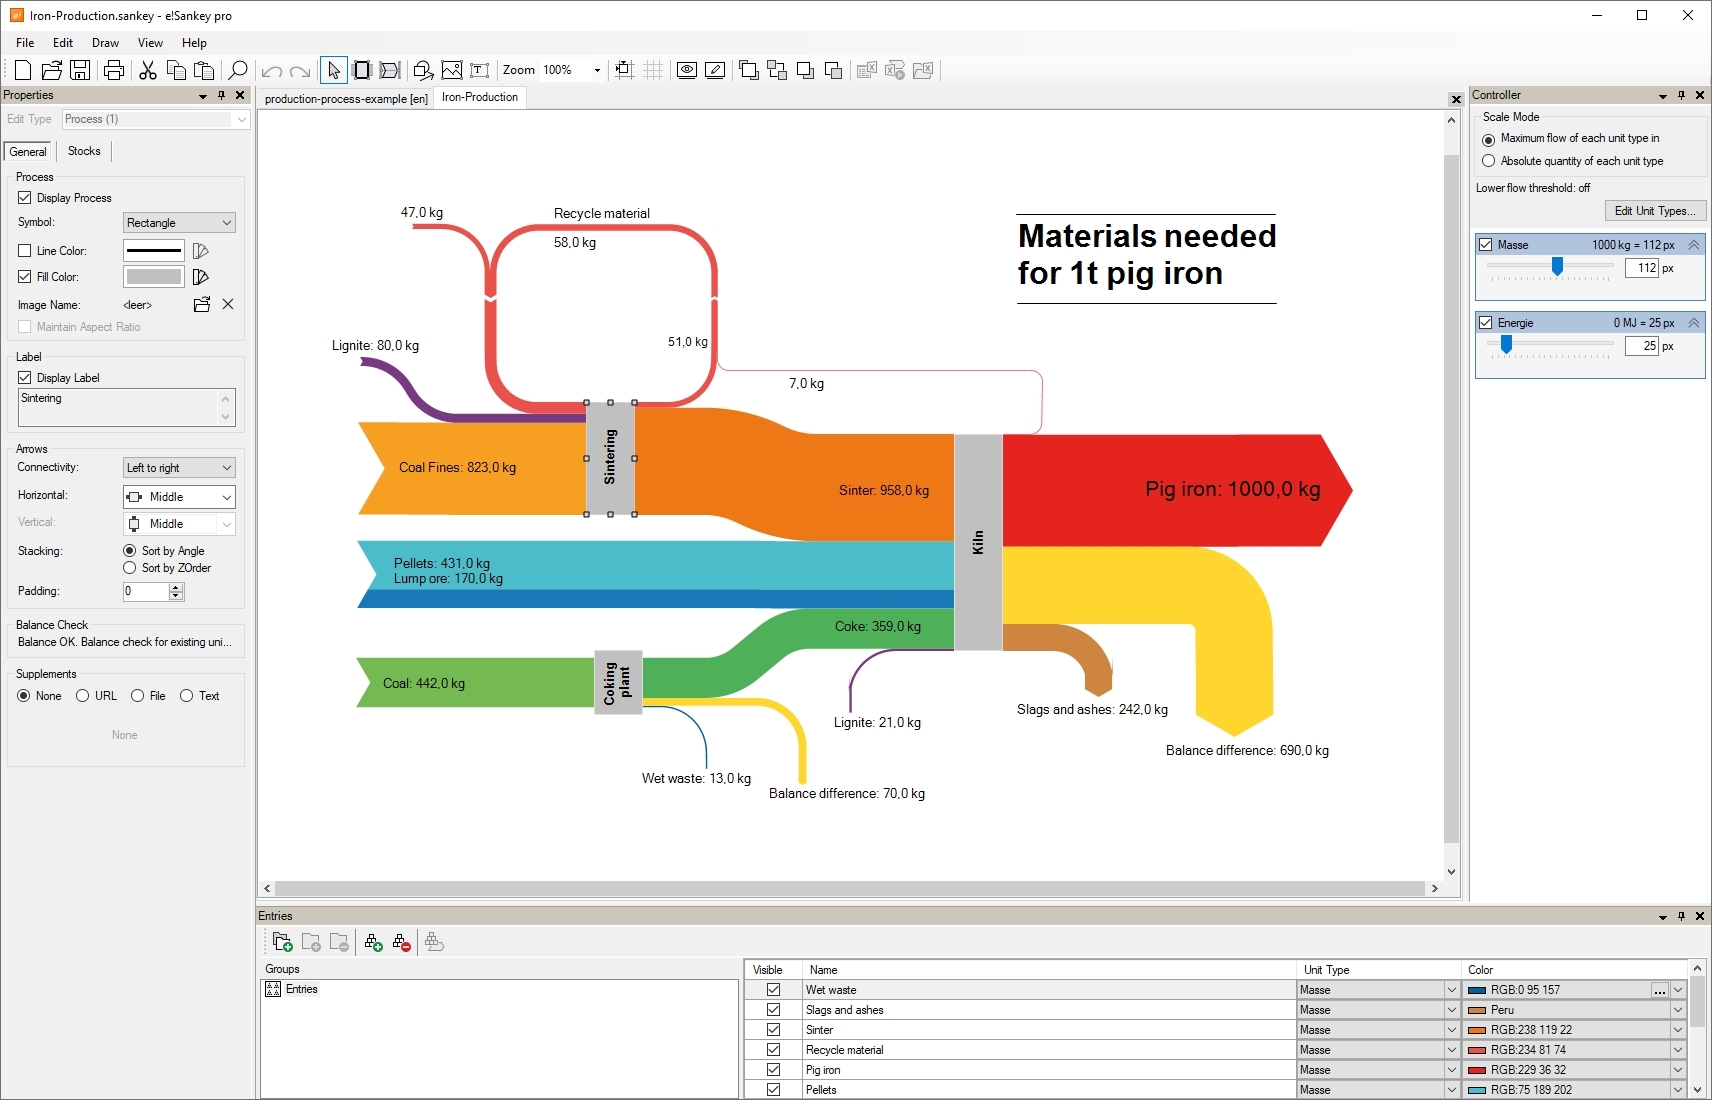
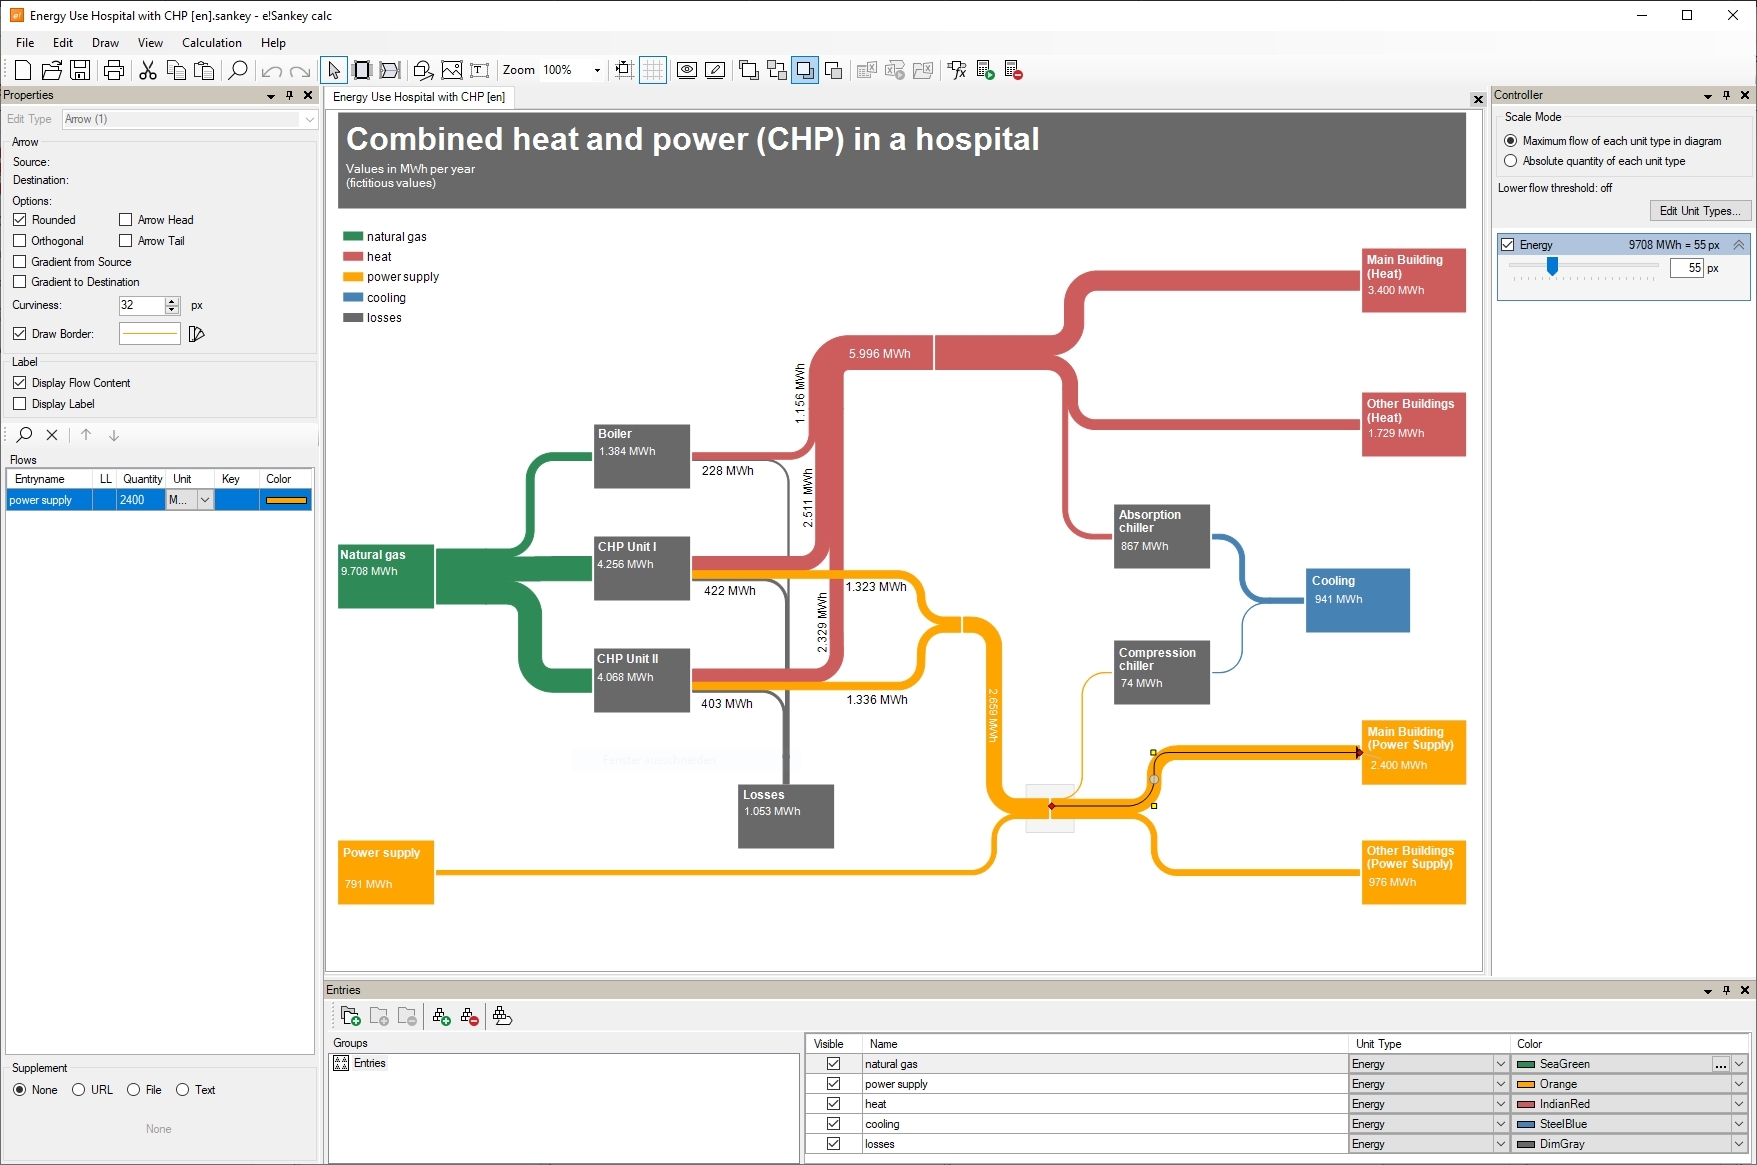
e!Sankey is specialized software for creating professional Sankey diagrams. The solution enables you to visualize energy, material, substance, cost, and quantity flows in a way that makes relationships immediately understandable. The width of the arrows is shown in proportion to the respective flow quantities. This allows you to quickly identify which processes cause particularly high consumption, losses, return flows, or cost shares.
The software is designed for companies, energy consultants, engineering firms, facility managers, research institutions, sustainability managers, and specialist departments that want to analyze, document, and present complex flows in a convincing way. Typical areas of application include energy audits, energy management, substance flow analyses, material flow analyses, process optimization, plant planning, process engineering, logistics, circular economy, and cost flow visualization.
A particular advantage of e!Sankey lies in the combination of intuitive diagram creation and technically precise visualization. You can place processes, connect flows, assign values, and design diagrams according to your requirements. Branches, return flows, and loops can also be mapped flexibly. The software calculates missing flow quantities, supports various units such as kWh, MWh, kg, tons, or euros, and checks the balance between inputs and outputs. Inconsistencies become visible at an early stage, allowing data errors to be identified while the diagram is being created.
Through the Excel connection, flow values, labels, and other data can be linked to spreadsheets. Changes in Excel can be automatically transferred to the diagram. This makes e!Sankey particularly suitable for recurring analyses, reports, and scenario comparisons. Results can be exported in common image formats and integrated into presentations, reports, or publications.
e!Sankey helps you prepare complex data in a clear, comprehensible, and visually appealing way. Instead of manually interpreting extensive columns of numbers, decision-makers receive a clear representation of the most important flows and relationships. This makes it easier to analyze energy consumption, material use, losses, cost structures, and optimization potential.
Especially in projects involving many stakeholders, e!Sankey creates a shared visual basis. Specialist departments, management, auditors, project partners, and customers can better understand the same data and make informed decisions. Thanks to its flexible design options, diagrams can be used both for technical detail analyses and for management presentations.
Engineers (especially process engineers, chemical engineers, environmental engineers)
Plant manager
In addition, persons who are active in
More than 10,000 licenses in over 100 countries
e!Sankey is software for creating Sankey diagrams. It visualizes energy, material, substance, cost, and quantity flows with proportional arrow widths.
A Sankey diagram shows not only values, but also their flow direction, distribution, and quantity ratio. This makes losses, branches, and optimization potential quickly visible.
Yes, e!Sankey can link data and flow values with Microsoft Excel. Changes in Excel data can be transferred to the diagrams.
Yes, e!Sankey can use known values to automatically calculate missing flow quantities. This reduces manual effort and supports consistent visualization.
Yes, the software supports different units such as kWh, MWh, kg, tons, or euros. Automatic conversions and consistent display formats are also possible.
e!Sankey provides a plausibility check. The software checks input and output flows at nodes and warns you of inconsistencies.
With e!Sankey, simple and complex flow structures can be created, including branches, return flows, cycles, and loops.
e!Sankey is suitable for industry, energy supply, engineering firms, research, facility management, sustainability management, waste management, logistics, and material management.
Yes, e!Sankey supports export to common formats such as PNG, JPG, and SVG. The diagrams can therefore be integrated into reports, presentations, and publications.